Listed housing stock rose 1.2% in the quarter yet remains 2.1% down year on year. Behind the national figure sits a sharp geography: Milan is accumulating unsold stock faster than anywhere, while the South keeps absorbing.
In the second quarter of 2026 the stock of homes listed for sale in Italy rose by 1.2% against the previous three months. Measured year on year, the same stock is down 2.1%. Both figures come from the same idealista research series, and they do not contradict each other: available supply keeps shrinking over the medium term, but stopped shrinking in the latest quarter.
The portal reads the quarterly increase as a slowdown in transactions rather than a return of supply. Properties stay listed longer and pile up in the shop window, without any meaningful wave of new mandates reaching the market. That fits with the longer listing durations recorded in June and with Tecnocasa figures putting average selling time in the major cities at around 108 days, barely changed from 109 a year earlier.
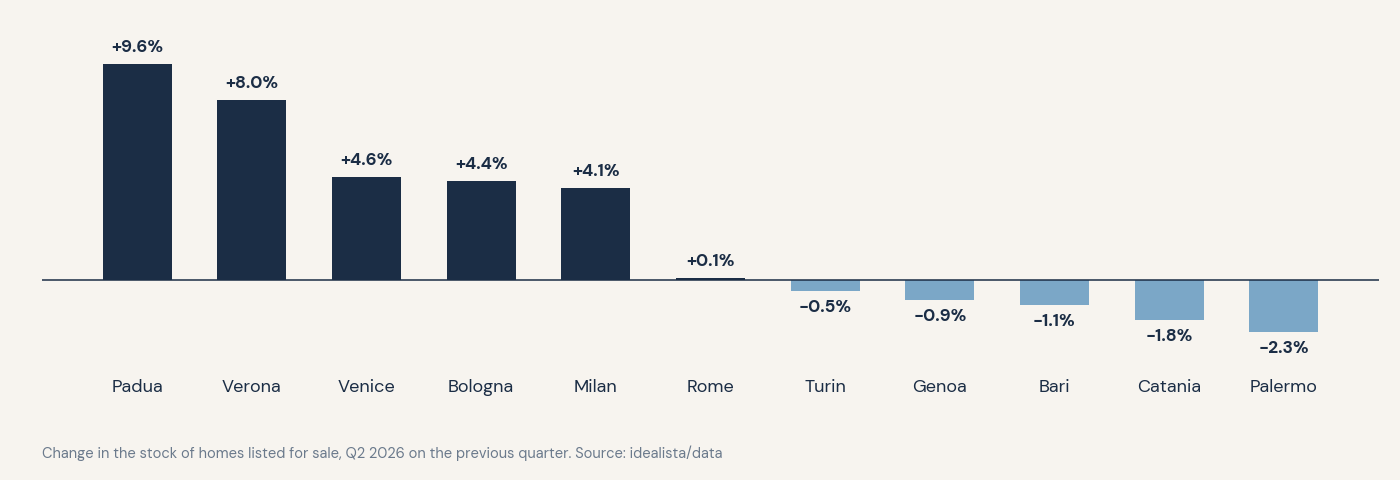
The national figure conceals a sharp geography. Of 110 provincial capitals tracked, 64 recorded rising supply and 46 falling supply, and the dividing line does not run between large and small markets. Padua is up 9.6%, Verona 8%, Venice 4.6%, Bologna 4.4%. Turin, Genoa, Bari, Catania and Palermo are all contracting, Palermo by 2.3%.
Milan is the most interesting case, with stock up 4.1% on the quarter and 6.1% on the year. It is the large city where supply is accumulating fastest, and the only one whose annual comparison is positive while the national figure stays negative. Rome moves the other way: flat on the quarter at 0.1%, down 3.4% over twelve months.
An apparent contradiction sits here, and it is worth unpicking. Milan is at once the fastest market to sell in — under ninety days against a national average of 108 — and the one accumulating the most unsold stock. Both hold if what enters the market has grown faster than absorption: average selling time stays low because Milanese product is more liquid, but inflow has outrun demand's capacity to clear it. That is the profile of a market approaching its price ceiling, not one seizing up.
How much weight the national 1.2% can carry remains an open question. Portal stock measures published listings, not completed sales: it tracks how quickly an advertisement is withdrawn, which depends on the deed but also on mandate expiry, listing renewals and agency commercial policy. A 1.2% quarterly move falls inside a range where seasonal and behavioural effects are hard to separate, particularly since spring is when sellers traditionally come to market. The annual figure, still negative, points to scarcity as the structural story. Should the slowdown continue, though, the two signs would converge within a few quarters.
Price context explains why this is not academic. Istat's house price index rose more than five per cent year on year in the first quarter, and values in the largest cities sit at their highest in a decade. When prices are elevated and rates have not returned to their lows, longer selling times are the first symptom to appear. Demand does not vanish; it becomes slower and more selective.
There is also a quality dimension that aggregate data struggles to capture. Part of the lengthening reflects how hard it is for the market to offer properties matching what buyers now want, from energy rating and size to outdoor space and state of repair. An ageing stock meeting demand that has shifted its requirements produces inventory that looks plentiful and behaves illiquid.
On the demand side, Nomisma describes a stable market underpinned by the return of mortgage credit as the main driver of transactions. That pushes against the slowdown: if lending keeps growing, pressure on the stock should reassert itself in the second half.
The safer reading, for now, is that supply is not returning but sitting still for longer, and that this is happening mainly where prices have run hardest. Inventory that builds through unsold accumulation erodes seller expectations gradually, and shows up in negotiations long before it shows up in asking prices. If Milan is leading the other mature markets, the signal worth watching over coming quarters is not the volume of available supply but the gap between asking price and closing price.