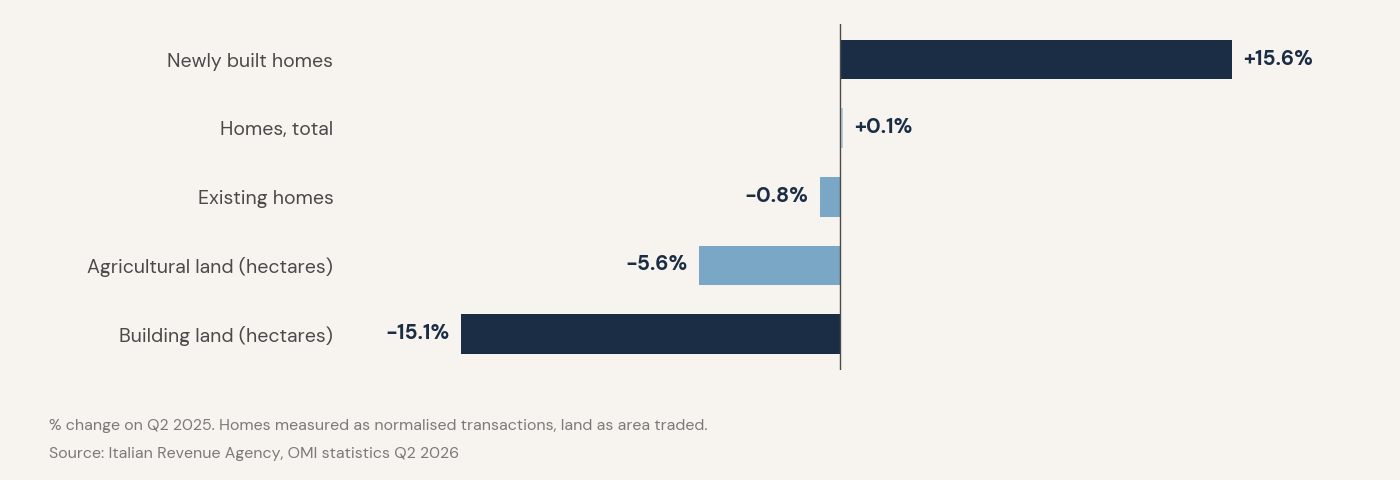
In Q2 2026 sales of newly built homes rose 15.6% while building land traded fell 15.1%. The two figures look at different stages of the cycle and, with the ECB hike and rising build costs, point to tighter future supply. Some caution is needed in reading them.
The Italian Revenue Agency's OMI statistics for the second quarter of 2026, released on 10 September, show a residential market that looks flat at first glance. Between April and June 201,596 homes changed hands, 0.1% more than a year earlier, with an uneven monthly pattern: +5.2% in April, -4.1% in May, -0.3% in June.
The aggregate hides two opposite movements. Sales of newly built homes rose 15.6%, lifting their share to 6.4%, while existing homes fell 0.8%. In the same release, building land traded dropped to 1,353 hectares, down 15.1% year on year and negative in every macro-area, from -4% in the Centre to -33.8% in the Islands. Agricultural land fell 5.6%.
Two different clocks
The two series capture distant stages of the same supply chain. A new home completed today usually comes from land bought, permitted and built three to five years ago, often pre-sold off-plan. Building land bought today feeds deliveries in the second half of the decade.
Read this way, growth in new homes is the tail of a cycle launched when rates were low. The shrinking land market points to thinner future supply.
Rates and costs pulling the same way
On 10 September the ECB raised its three key rates by 25 basis points, taking the deposit rate to 2.50% from 16 September, its second hike this year, driven by inflation linked to the Middle East conflict. Nomisma estimates a lag of about six months before sales feel the effect.
Istat reports construction producer prices for buildings up 3.1% year on year in July. A buyer of land today must assume higher carrying costs, rising build costs and sale prices that, with flat volumes, will struggle to outpace inflation. Residual land value is squeezed by subtraction, and sellers are slow to accept it.
Household credit is holding for now: 46.6% of purchases use a mortgage, at an average first-instalment rate of around 3.6%.
How far to trust -15.1%
Three reasons for caution.
Scale first. Just over 1,300 hectares trade nationally in a quarter, measured as normalised area rather than deeds. A handful of large deals can move the figure by several points, as the Islands' -33.8% suggests.
Second, what the series misses. In large cities residential development increasingly replaces disused sheds and obsolete offices, which are recorded as building sales, not land. Sites transferred through share deals or fund contributions do not appear at all. The decline may overstate the contraction of the metropolitan pipeline and better describe smaller towns, where greenfield expansion matters more.
Third, timing. One quarter is not a trend. A reversal would need the negative sign on land to persist into the third and fourth quarters.
Scarcity forming upstream
With those caveats, the direction is readable. Today's new supply was decided under a different rate regime, and the flow meant to replace it is thinning just as money becomes expensive again. If demand for efficient homes keeps diverging from existing stock, as the gap between +15.6% and -0.8% suggests, scarcity of new product late in the decade could support that segment's prices more than current volumes imply.